

How Much B2B Lead Generation Costs
B2B lead generation costs range from $40 to $800+ per lead, depending on industry, lead quality, channel, and whether you use an agency or build in-house. The average cost per lead (CPL) across B2B industries in 2026 is $198, with technology and SaaS companies at $208, financial services at $272, and healthcare at $286.
Agency retainers for B2B lead generation services typically run $3,000–$20,000 per month, while in-house teams cost $250,000–$500,000+ annually, fully loaded. The most important metric isn't CPL, it's customer acquisition cost (CAC) relative to customer lifetime value (LTV), which determines whether your lead-generation investment is profitable.
If you've ever tried to get a straight answer on what B2B lead generation actually costs, you've probably encountered one of two things: a vague "it depends" from an agency sales rep, or a benchmark number with no context for what drove it.
Both are useless when you're trying to build a business case, set a marketing budget, or evaluate whether an agency proposal is reasonable.
This guide gives you the actual numbers, CPL benchmarks by industry and channel, agency pricing model breakdowns, in-house vs. outsourced cost comparisons, and the CAC and LTV frameworks that determine whether your lead-generation costs are sustainable.
B2B Lead Generation Cost Benchmarks by Industry (2026)
The single most-searched piece of information in this category is: "What's a normal cost per lead for my industry?" Here's the answer.
|
Industry |
Average CPL |
CPL Range |
Notes |
|
Technology / SaaS |
$208 |
$100–$400 |
Higher for enterprise, lower for SMB-focused tools |
|
Financial Services |
$272 |
$150–$500 |
Compliance requirements drive up qualification cost |
|
Healthcare |
$286 |
$150–$600 |
Long cycles, regulatory complexity |
|
Manufacturing |
$235 |
$100–$450 |
Technical complexity increases nurture cost |
|
Professional Services |
$212 |
$100–$400 |
Relationship-driven, referral mix varies |
|
Education |
$55 |
$25–$150 |
Shorter cycles, broader ICP |
|
Marketing / Advertising |
$172 |
$75–$350 |
High competition for attention |
|
Media / Publishing |
$108 |
$50–$250 |
Content-driven, strong inbound potential |
|
Retail / eCommerce |
$34 |
$15–$100 |
Typically B2C-adjacent, shorter cycles |
|
Telecom |
$45 |
$20–$120 |
Higher volume, lower per-unit cost |
Source: FirstPageSage B2B Lead Generation Cost Benchmarks 2026 · HubSpot State of Marketing 2026
These are averages across all channels. Your actual CPL will sit above or below this range depending on the quality of leads you require, how senior your target contacts are, and which channels you use to reach them.
B2B Lead Generation Cost by Channel (2026)
Channel selection is the second biggest cost driver after industry. Here's how the main channels compare in terms of CPL, volume potential, and time to results.
|
Channel |
Average CPL |
Volume Potential |
Time to Results |
Best For |
|
SEO / Organic Content |
$31 |
High (compounding) |
6–12 months |
Long-term pipeline, category authority |
|
Email Outreach |
$45 |
High |
2–4 weeks |
Outbound SDR programs |
|
LinkedIn Ads |
$75–$300 |
Medium |
2–4 weeks |
Senior decision-maker targeting |
|
PPC / Paid Search |
$116 |
High |
1–2 weeks |
High-intent bottom-funnel captures |
|
Content Syndication |
$60–$150 |
High |
4–8 weeks |
MQL generation at scale |
|
Webinars |
$72–$300 |
Medium |
4–6 weeks |
Mid-funnel engagement |
|
Telemarketing / SDR |
$100–$300 |
Medium |
2–6 weeks |
Appointment setting, qualification |
|
Trade Shows |
$200–$600 |
Low |
1 event |
Relationship-intensive deals |
|
Direct Mail |
$30–$150 |
Low-medium |
3–6 weeks |
High-value account targeting |
|
Referral Programs |
$15–$50 |
Low |
Ongoing |
Highest-quality, lowest-cost leads |
Source: HubSpot — SEO vs PPC Cost Per Lead · FirstPageSage Channel CPL Report 2026
The most important observation from this table: organic/SEO leads average $31 per lead, nearly six times cheaper than PPC at $116, but take 6–12 months to compound. Teams that invest in both create a compound advantage: cheap organic leads at scale while paid channels generate an immediate pipeline.
What Are the Key Lead Generation Cost Factors?
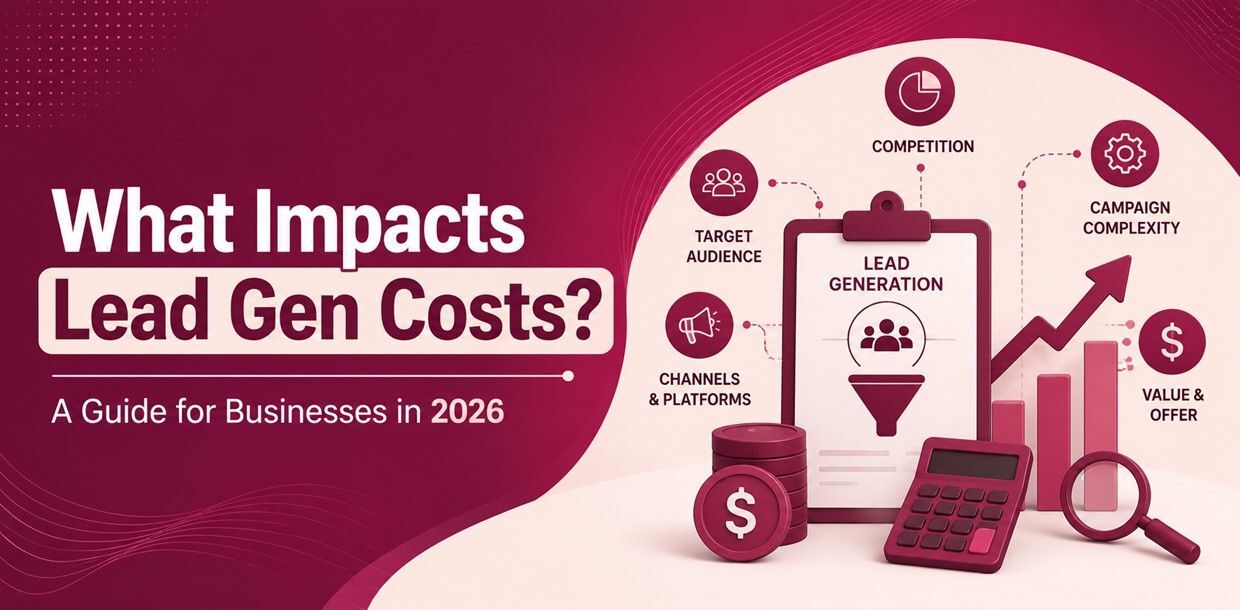
CPL benchmarks are useful baselines. But your actual lead generation costs are determined by eight specific factors. Understanding them is what lets you control costs rather than just observe them.
1. Target Audience Seniority and Specificity
Targeting a VP of Finance at a 500-person fintech company costs 3–5x more than targeting a mid-level manager at an SMB. Senior decision-makers are harder to reach, require more personalized outreach, and take longer to convert.
The more narrowly defined your ICP, by revenue band, industry subsector, job title, tech stack, the higher the per-lead cost. But narrow ICP targeting typically produces higher downstream conversion rates, which lowers your overall customer acquisition cost (CAC) even if CPL appears high.
2. Lead Quality Level Required
Lead quality has a dramatic impact on lead generation pricing. There are four distinct quality tiers with completely different cost structures:
|
Lead Quality Tier |
Description |
Typical CPL |
|
Raw contact |
Name, email, company — unverified |
$5–$20 |
|
MQL |
Engaged with content, ICP-fit |
$40–$150 |
|
SQL |
Qualified by sales criteria, verified intent |
$150–$400 |
|
Sales-ready opportunity |
Qualified, meeting booked, decision-maker engaged |
$400–$1,000+ |
The cheapest leads are almost never the most cost-effective. A Marketo study found companies focusing on higher-quality leads experienced 50% higher win rates and 33% lower CAC despite paying more per lead. The downstream conversion savings more than offset the higher upfront CPL.
3. Lead Generation Methodology
Different methodologies carry fundamentally different cost structures:
|
Methodology |
Monthly Investment |
CPL Range |
Best For |
|
Inbound / Content |
$10,000–$25,000+ |
$15–$75 |
Long-cycle, educational buying |
|
Outbound SDR |
$5,000–$15,000 |
$35–$200 |
Predictable pipeline flow |
|
Paid Media |
$5,000–$50,000+ |
$75–$500 |
Fast volume, high-intent capture |
|
ABM |
$15,000–$50,000+ |
$200–$800 |
Enterprise, named-account programs |
|
Events |
$15,000–$100,000+ |
$200–$600 |
Relationship-intensive sales |
The most effective B2B lead generation strategies in 2026 combine outbound SDR with content-driven inbound — capturing buyers who are actively searching while proactively reaching buyers who match the ICP but haven't yet started looking.
4. Technology Stack
The tooling required to run an effective lead generation program represents a high ongoing cost that most budget estimates undercount:
|
Tool Category |
Monthly Cost Range |
|
CRM (Salesforce, HubSpot) |
$12–$300/user |
|
Marketing Automation |
$800–$3,000+ |
|
Lead Intelligence / Intent Data |
$1,000–$5,000+ |
|
Data Providers / Contact Lists |
$500–$5,000+/month |
|
Email Infrastructure |
$200–$2,000+ |
|
Analytics / Attribution |
$500–$5,000+ |
Total technology overhead typically adds $4,000–$20,000/month to lead generation program costs, an amount that's often omitted from agency comparisons and in-house vs. outsourced analyses.
5. Geographic Market
Lead generation costs vary significantly by geography. North American and Western European leads command the highest CPL due to market competition and buyer sophistication. APAC and LATAM markets typically run 30–50% lower CPL, though qualification rates may differ.
6. Sales Cycle Length
Longer sales cycles require more touchpoints, more nurturing content, and more SDR time per qualified lead, all of which increase total cost per opportunity. A complex enterprise sale with a 9-month cycle can cost 3–5x more per qualified opportunity to generate than a transactional SMB sale closing in 30 days.
7. Brand Recognition and Market Position
Companies with strong brand recognition spend less to acquire the same lead. Buyers who already know you convert faster, require less nurturing, and are more likely to respond to outreach. Investment in brand, through content, thought leadership, AEO, and PR, creates a compounding cost reduction in lead generation over time.
8. In-House vs. Agency Model
This is the decision with the largest single impact on lead generation costs. We cover it in full below.
In-House vs. Agency Lead Generation: Full Cost Comparison
This is the question most B2B marketing leaders wrestle with before committing budget. Here's the honest comparison.
In-House Lead Generation Costs
Building a basic in-house lead generation team:
|
Role |
Annual Fully-Loaded Cost |
|
Demand Gen Manager |
$100,000–$140,000 |
|
SDR (x2) |
$80,000–$100,000 each |
|
Content / SEO Specialist |
$70,000–$95,000 |
|
Marketing Ops |
$80,000–$110,000 |
|
Total Personnel |
$410,000–$545,000/year |
Add technology stack ($50,000–$100,000+ annually), paid media budget, content production, and management overhead, and a functional in-house lead generation operation runs $600,000–$900,000+ annually before it's fully productive.
Ramp time adds cost: the average SDR takes 3–6 months to reach full productivity. Attrition adds more — SDR turnover in B2B averages 35–40% annually, meaning you're rebuilding the function roughly every 2–3 years.
Lead Generation Agency Pricing Models
|
Pricing Model |
Typical Range |
Best For |
Risk Level |
|
Retainer |
$3,000–$20,000/month |
Consistent pipeline, ongoing programs |
Low |
|
Performance / Pay-per-lead |
$50–$500/qualified lead |
Budget-controlled testing |
Medium |
|
Pay-per-meeting |
$300–$800/appointment |
Appointment setting validation |
Medium |
|
Hybrid |
Retainer + performance |
Balanced risk and accountability |
Low-Medium |
|
Project-based |
$5,000–$50,000/project |
Specific campaigns or market entry |
Low |
Lead generation agency costs for a full-service B2B program, including outbound SDR, content, and paid media management, typically run $8,000–$25,000/month, or $96,000–$300,000 annually. That's 30–70% less than a comparable in-house team, with faster ramp time and no attrition risk.
The Honest Cost Comparison
|
Factor |
In-House |
Agency |
|
Year 1 total cost |
$600,000–$900,000+ |
$96,000–$300,000 |
|
Speed to pipeline |
4–6 month ramp |
2–4 weeks |
|
Attrition risk |
High (35–40% annual SDR turnover) |
None |
|
Scalability |
Requires hiring |
Scope adjustment |
|
ICP expertise |
Built over time |
Pre-built |
|
Break-even vs. agency |
18–24 months |
Immediate |
The break-even point at which in-house becomes more cost-effective than an agency typically comes at 18–24 months, assuming the team achieves target efficiency metrics. Most companies outsource first, validate the playbook, then build selectively in-house for the functions that benefit from institutional knowledge.
How to Calculate True Lead Generation ROI: CAC, LTV, and Pipeline Velocity
CPL is the wrong metric to optimize. Here's the framework that predicts whether your lead-generation investment is profitable.
Customer Acquisition Cost (CAC)
CAC = Total Sales + Marketing Spend ÷ Number of New Customers Acquired
If you spent $200,000 on lead generation and sales this quarter and acquired 20 customers, CAC = $10,000.
CAC is the metric your CFO cares about. Not CPL. A lead that costs $500 but converts at 30% generates a $1,667 CAC. A lead that costs $50 but converts at 2% generates a $2,500 CAC. The expensive lead wins.
LTV: CAC Ratio
The target ratio for sustainable B2B growth: 3:1 or higher — meaning every $1 spent acquiring a customer generates $3+ in lifetime revenue.
|
LTV: CAC Ratio |
Interpretation |
|
Below 1:1 |
Losing money on every customer |
|
1:1 – 2:1 |
Marginal — unsustainable at scale |
|
3:1 |
Healthy — reinvest to grow |
|
5:1+ |
Strong — potential to invest more aggressively |
If your ratio is below 3:1, the problem is either that CAC is too high (fix lead quality and conversion), LTV is too low (fix retention and expansion), or both.
Pipeline Velocity
Pipeline Velocity = (Number of Opportunities × Win Rate × Average Deal Value) ÷ Sales Cycle Length
This forward-looking metric predicts future revenue more reliably than CPL or even current sales. Improving any of the four variables, such as more opportunities, a higher win rate, larger deals, or shorter cycles, increases pipeline velocity without necessarily increasing lead generation spend.
Marketing Budget Allocation: How Much Should You Spend on Lead Generation?
Industry benchmarks for B2B marketing budget allocation as a percentage of revenue:
|
Company Stage |
Marketing as % of Revenue |
Lead Gen as % of Marketing Budget |
|
Early stage (under $5M ARR) |
15–25% |
60–70% |
|
Growth stage ($5M–$50M ARR) |
10–20% |
50–65% |
|
Scale stage ($50M–$200M ARR) |
8–15% |
40–55% |
|
Enterprise ($200M+ ARR) |
5–12% |
30–45% |
Source: Gartner CMO Spend Survey 2026
For early-stage B2B companies: spend 15–25% of revenue on marketing, with the majority allocated to lead-generation programs that build an immediate pipeline rather than to brand-building that compounds over the years.
For growth-stage companies, the split begins to shift toward demand creation: content, SEO, AEO, and thought leadership, as brand recognition reduces the cost of lead acquisition over time.
How Revnew Approaches Lead Generation Costs
The most common pricing mistake we see B2B companies make is optimizing for the lowest CPL, then wondering why the pipeline doesn't convert.
A raw lead at $20 that never qualifies has an infinite effective CAC. A sales-qualified meeting at $400 that converts to a $50,000 deal at 30% generates a $1,333 CAC on a $50,000 ACV, a 37x return before LTV.
At Revnew, our B2B lead generation services are built around qualified pipeline generation, not contact volume. Our model combines a 50M+ verified buyer dataset with intent-signal prioritization, ensuring outreach reaches accounts in active buying windows rather than broad lists that inflate CPL with unqualified contacts.
For one B2B SaaS client running a high-volume, low-quality outbound program, we reduced outreach volume by 60% while increasing qualified pipeline by 47% by replacing list-based sequencing with signal-triggered outreach. Their effective CAC dropped by 38% in one quarter without reducing lead-generation spend. The investment stayed the same. The targeting precision changed everything.
Results like the $4.2M pipeline we generated for ViTel Net in 120 days aren't driven by high volume; they're driven by reaching the right accounts at the right moment.
5 Strategies to Reduce B2B Lead Generation Costs Without Reducing Quality
1. Invest in lead scoring before investing in more leads. A scoring model that routes only ICP-fit, high-intent accounts to your SDRs can cut cost per qualified lead by 30–50% without changing your top-of-funnel volume. The leads aren't cheaper, you're just spending SDR time on fewer, better ones.
2. Build organic infrastructure alongside paid programs. SEO and content compound over time. A blog post that ranks for a high-intent keyword generates leads at $31 each, indefinitely, after the initial production cost. Paid channels cost the same per click forever. Invest in organic early so paid budgets become supplementary rather than the primary source.
3. Use intent data to time outreach. Reaching an ICP-fit account when they're actively researching solutions converts at 3–5x the rate of reaching the same account at a random point in their buying cycle. Intent data tools that identify these windows dramatically reduce wasted outreach costs.
4. Optimize lead nurturing before increasing top-of-funnel spend. Nurtured leads make 47% larger purchases than non-nurtured leads (Marketo, 2026). If your lead-to-close conversion rate is low, adding more leads amplifies the problem. Fix the conversion rate first, then scale the volume.
5. Align sales and marketing on a shared SQL definition. The most common source of wasted lead-generation spend is marketing generating MQLs that sales can't work with because the qualification bar is different. A shared, written SLA that defines exactly what a sales-ready lead looks like before any campaign launches eliminates the budget waste of generating leads that never enter a real sales process.
FAQs
Q: How much does B2B lead generation cost per lead in 2026?
The average B2B cost per lead across industries is $198, ranging from $31 for organic/SEO leads to $500+ for fully qualified enterprise opportunities. Industry matters significantly: technology companies average $208 per lead, financial services $272, and healthcare $286. These are averages across all channels and lead quality levels; your actual CPL will be higher or lower depending on how senior your target contacts are, how narrowly your ICP is defined, and which channels and lead quality tiers you're targeting.
Q: What is a reasonable budget for a B2B lead generation agency's costs?
A full-service B2B lead generation agency retainer runs $5,000–$20,000 per month, depending on scope, channels, and the number of markets covered. Specialized appointment-setting services cost $3,000–$10,000/month. Performance-based or pay-per-meeting models charge $300–$800 per qualified appointment. The right benchmark isn't the monthly fee, it's the cost per qualified meeting and the downstream meeting-to-opportunity conversion rate. A $10,000/month retainer generating 20 qualified meetings at $500 each beats a $5,000/month retainer generating 5 meetings at $1,000 each every time.
Q: How do you calculate customer acquisition cost (CAC) for lead generation?
CAC = Total Sales and Marketing Spend ÷ Number of New Customers Acquired in the same period. If you spent $150,000 on lead generation and sales in Q1 and acquired 15 new customers, your CAC is $10,000. The target LTV: CAC ratio for sustainable B2B growth is 3:1 or higher, meaning each customer generates at least 3x what it costs to acquire them. If your ratio is below 3:1, the problem is either CAC too high (improve lead quality and conversion) or LTV too low (improve retention and expansion revenue).
Q: Is it cheaper to build in-house lead generation or hire a B2B lead generation agency?
In year one, agencies are significantly cheaper: a full-service B2B lead generation agency costs $96,000–$300,000 annually, versus $600,000–$900,000+ for a comparable in-house team, fully loaded. The in-house model can become more cost-effective after 18–24 months once processes are established and technology investments are amortized, but only if attrition stays low. Given the average SDR turnover of 35–40% annually, many companies find the agency model remains cost-competitive over the long term due to the ongoing costs of recruiting, onboarding, and ramping up replacement hires.
Q: What is a healthy marketing budget allocation for B2B lead generation?
Early-stage B2B companies (under $5M ARR) should allocate 15–25% of revenue to marketing, with 60–70% of that budget directed toward lead generation programs. Growth-stage companies ($5M–$50M ARR) typically run 10–20% of revenue on marketing, with 50–65% toward lead generation. As companies scale past $50M ARR, the ratio shifts toward brand and demand creation, reducing reliance on paid lead generation as organic and referral channels compound. The consistent principle across all stages is to measure marketing spend against pipeline contribution and LTV:CAC, not against absolute CPL benchmarks.
The budget question worth running before your next planning cycle: Do you know your LTV: CAC ratio right now? If that number isn't on a dashboard your revenue team reviews monthly, your lead generation investment decisions are being made without the one metric that actually tells you whether the spend is working.